
SEQUENT Logo

App Development Report — 2026

App DevelopmentReport 2026

Your hub for 2026 app development benchmarks — industry trends, real project costs, and delivery timelines from SEQUENT' engineering data.
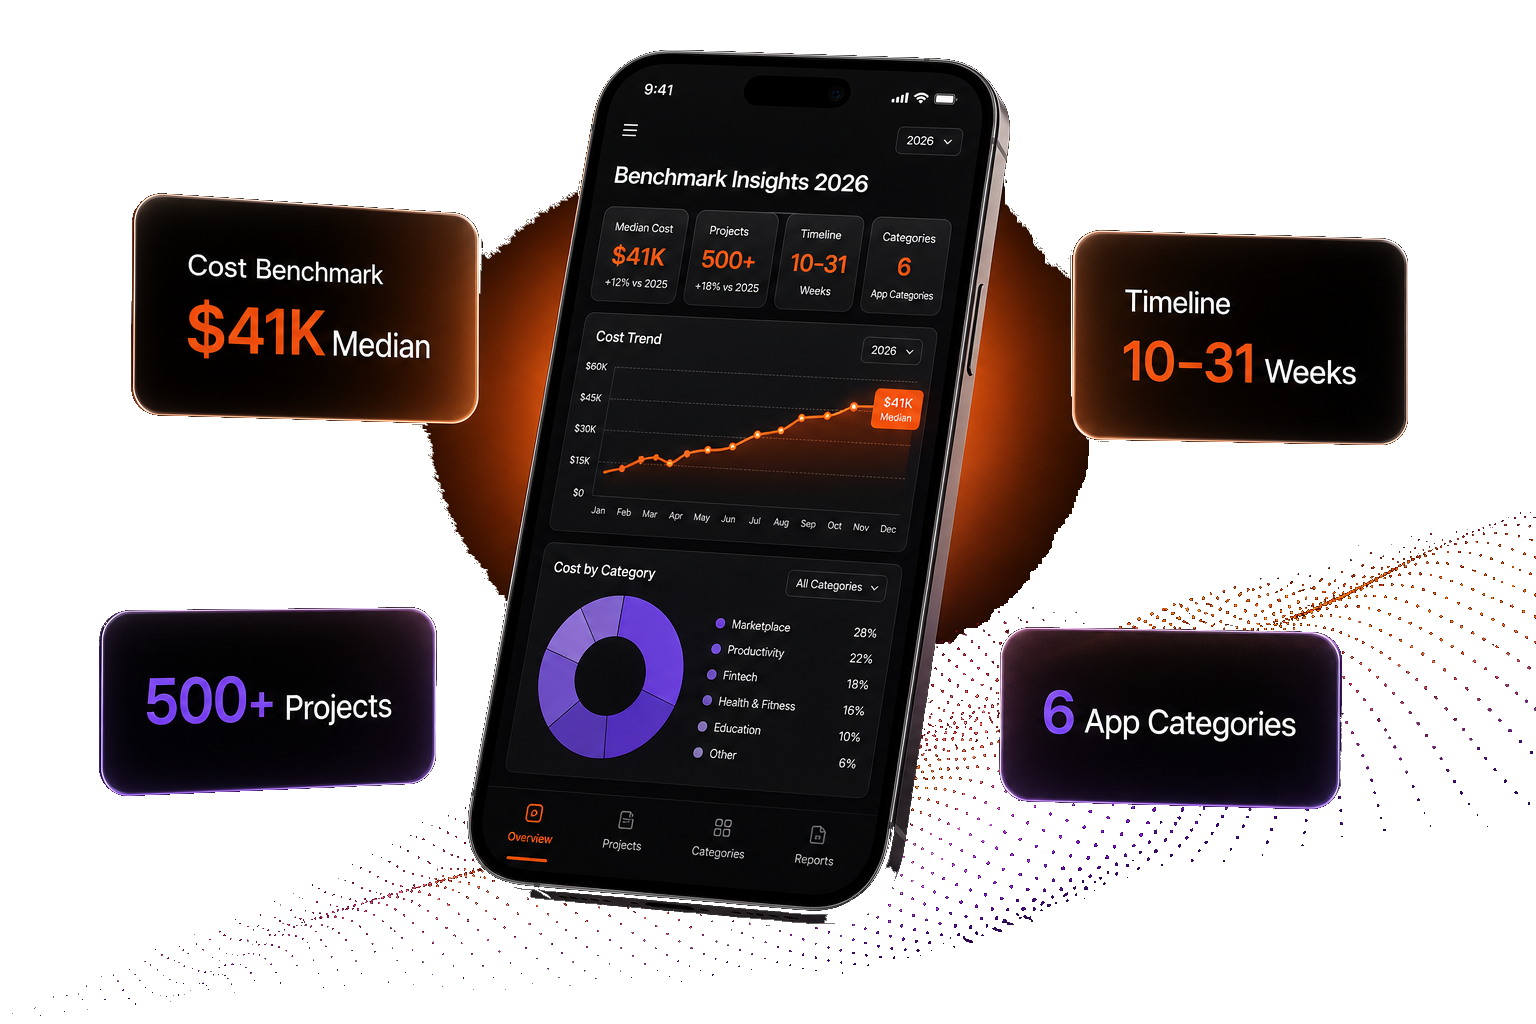
Benchmark Insights 2026 — phone dashboard with cost, timeline, AI, and framework cards
OVERVIEW

What this hub covers

App development spans wildly different cost and timeline realities depending on category, region, and platform choice — a content app and a fintech app at the same "mid-complexity" label can differ in cost by 4x. This hub organizes everything we publish on the topic into one navigable structure, backed by data from 500+ completed projects rather than industry guesswork.

Start with the State of App Development Report for the broad industry picture — AI adoption, framework shifts, and how delivery teams are changing. For project-specific planning, the Benchmark Report breaks cost and timeline down by app category, development region, and platform strategy, so you can sanity-check a quote against real numbers before you sign anything.
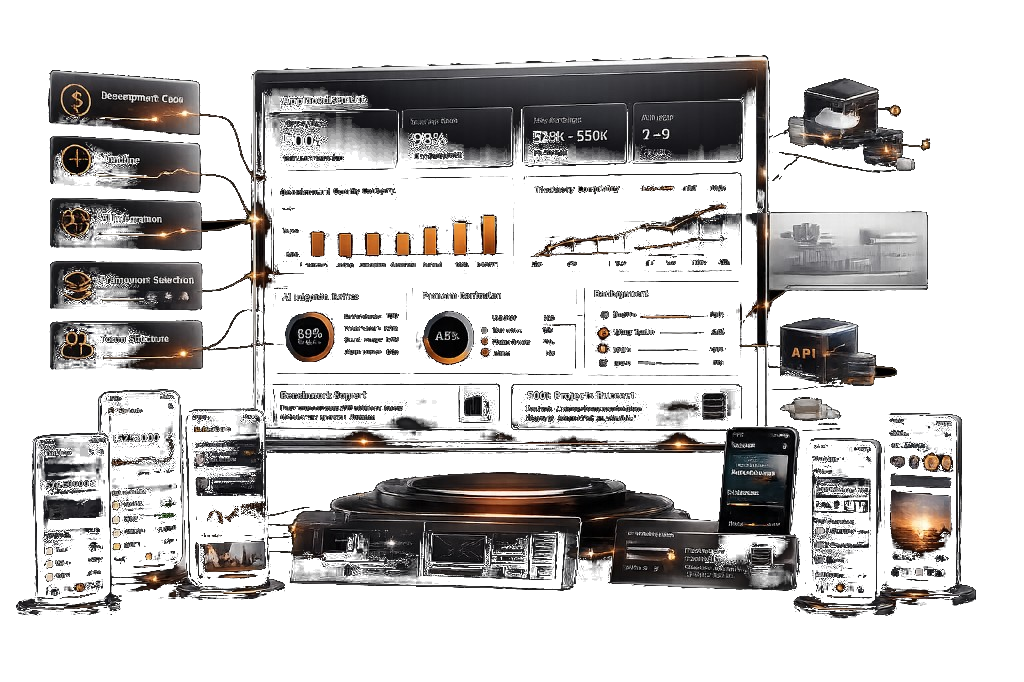
App development report hub — cost, timeline, AI, frameworks, and delivery insights
EXPLORE

Browse by Topic

The full resource cluster, organized by what you're trying to figure out.

Team & Vendor Selection

Coming Soon

How to vet an app development agency, checklist included.

App Store & Compliance

Coming Soon

Common rejection causes and how to budget time for review cycles.

Post-Launch & Maintenance

Coming Soon

What ongoing iteration actually costs after v1.0 ships.

INDEX

All Resources

State of App Development Report 2026
ReportLive2026-01
Mobile App Development Benchmark Report 2026
ReportLive2026-01
How to Scope an App Development Budget
GuidePlanned
Vetting an App Development Agency
ChecklistPlanned
App Store & Compliance Guide
GuidePlanned
Post-Launch & Maintenance Costs
GuidePlanned

Get every report as one data pack

Both reports, all benchmark tables, and the full methodology — one PDF.

Download Data Pack

Ready for the full pack?

Tell us where to send it — we'll share both reports and the complete benchmark data pack.

Download Data Pack
Soft gradient background behind testimonials
Decorative background for testimonial content
OUR
TESTIMONIALS
Our Work
Speaks For Us

John Labkins

Partner & CEO, Healthcare Product

We hired SEQUENT for our healthcare website development project, and they exceeded our expectations. The team delivered a stunning, user-friendly website that perfectly represents our brand. Their attention to detail and dedication to our vision were outstanding. We couldn't be happier with the result!

Amanda Chen

Network Manager, Tech Solutions

SEQUENT transformed our digital presence. Their expertise and professionalism made the entire process smooth and stress-free. Highly recommend for any business looking to elevate their online presence.

Daniel Leg

CIO, E-Commerce Inc

From strategy to launch, SEQUENT delivered excellence at every stage. Our new platform has significantly improved user engagement and conversion rates. A true partnership.

Sarah Mitchell

Marketing Director, Brand Co

The creativity and technical skill of the SEQUENT team is unmatched. They understood our brand from day one and brought our vision to life with precision and flair.

Michael Torres

Founder, Startup Labs

Working with SEQUENT was a game-changer. They're responsive, innovative, and truly care about their clients' success. Our project was completed on time and beyond expectations.

Decorative graphic in 3D text rotation section
FAQ

Frequently Asked
Questions

Median cost across the dataset is $41,000, ranging from ~$12K for simple content apps to $180K+ for compliance-heavy fintech builds. See the full cost benchmark table for category and region breakdowns.
Median delivery time is 14.2 weeks for a mid-complexity cross-platform app, kickoff to production launch. Enterprise-grade builds run 25–35 weeks.
Flutter holds 54% market share in the dataset vs. React Native's 38%, with a roughly 6% lower median cost for equivalent scope. React Native still has a larger hiring pool. Full scoring in the framework comparison.
Not measurably in on-time delivery rate — the data shows no meaningful gap between regions on that metric, though day rates vary up to 3.1x across regions.
29% of projects in the dataset exceeded their initial quote, most commonly from third-party integrations discovered mid-build, added offline-mode requirements, and late-stage UI polish requests.